-
[경제] (Economist) Investors should treat analysis of bond yields with caution2023.10.14 PM 05:32
이코노미스트 기사 요약 (ChatGPT)
기사는 투자자들이 채권 수익률과 수익률 곡선을 분석할 때 주의해야 할 사항에 대해 논의합니다. 장기와 단기 채권 수익률의 차이를 나타내는 수익률 곡선은 분석가들에게 우려의 원인이 되어 왔습니다. 특히 수익률 곡선이 역전되면 이는 종종 침체의 전조로 간주되기 때문입니다. 그러나 최근에는 수익률 곡선이 다시 정상화되고 있는데, 이 역시 우려를 불러일으킬 수 있습니다.
이러한 우려에 기여하는 한 가지 요인은 높아지는 기간 프리미엄입니다. 기간 프리미엄은 투자자들이 장기간 동안 불확실성이 증가함에 따라 더 장기 만기의 증권을 보유하기 위해 요구하는 추가 수익률을 나타냅니다. 기간 프리미엄을 추정하는 것은 복잡하고 간접적인 프로세스이며, 향후 10년 동안 단기 이자율을 예측하는 과정을 포함합니다.
이 기사는 기간 프리미엄을 정확하게 측정하고 해석하는 것이 어려움을 강조합니다. 기간 프리미엄은 향후 단기 금리에 대한 많은 가정을 포함하기 때문입니다. 또한 수익률 곡선 또는 기간 프리미엄의 변화가 미치는 영향을 평가할 때 사용할 수 있는 역사적 데이터는 제한적입니다.
채권 시장의 움직임은 다양한 요인에 의해 영향을 받을 수 있기 때문에 채권 수익률을 특정 원인에 기인시키기가 어렵습니다. 결과적으로 수익률 곡선의 형태에 기반하여 미래를 예측하는 것은 정확한 과학적 노력보다는 찻잎으로 점을 치는 것에 더 가깝습니다. 투자자 및 분석가는 수익률 곡선과 기간 프리미엄의 변화가 미치는 영향을 평가할 때 이러한 현실적인 문제를 고려해야 합니다.
채권 수익률 변화의 원인은 복잡하고 다양할 수 있지만, 장기 채권 수익률 상승은 장기간 차입을 원하는 미국 기업과 30년 만기 금리에 연동된 새로운 모기지 대출을 받는 차입자에게 부정적인 영향을 미칠 수 있다는 것은 분명합니다.
======================================================
The exercise is more like reading tea leaves than scientific endeavour

Image: Satoshi Kambayashi
Oct 12th 2023
It was james carville, an American political strategist, who said, in an oft-repeated turn of phrase, that if he was reincarnated he would like to return as the bond market, owing to its ability to intimidate everyone. Your columnist would be more specific: he would come back as the yield curve. If the bond market is a frightening force, the yield curve is the apex of the terror. Whichever way it shifts, it seems to cause disturbance.
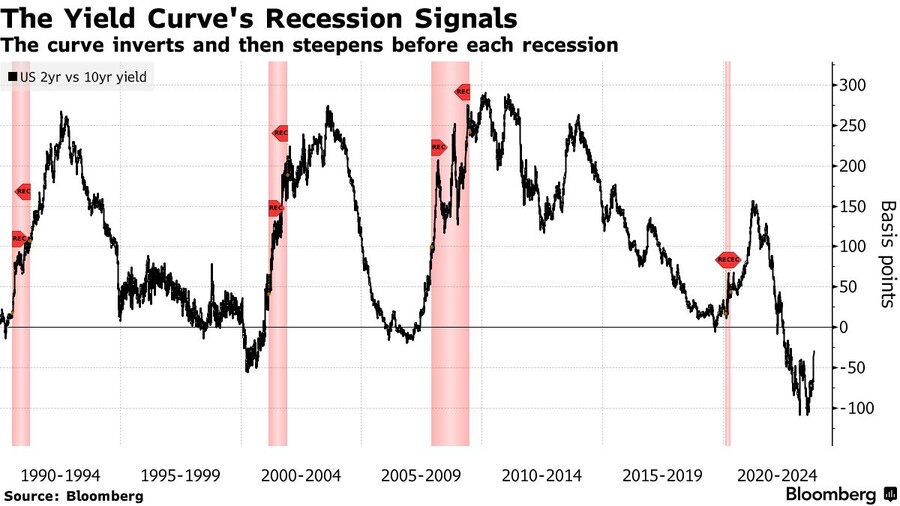
When the yield curve inverted last October, with yields on long-term bonds falling below those on short-term ones, analysts agonised about the signal being sent. After all, inverted curves are often followed by recessions. But now the curve seems to be disinverting rapidly. The widely watched 10-2 spread, which measures the difference between ten- and two-year bond yields, has narrowed markedly. In July two-year yields were as much as 1.1 percentage points above their ten-year equivalents, the biggest gap in 40 years. They have since drawn much closer together, with only 0.3 of a point between the two yields.

Since the inversion of the yield curve was taken as such a terrible omen, an investor would be forgiven for thinking that its disinversion would be a positive sign. In fact, a “bear steepener”, a period in which long-term bonds sell off more sharply than short-term bonds (as opposed to a “bull steepener”, in which short-term bonds rally more sharply than long ones), is taken to be another portent of doom in market zoology.

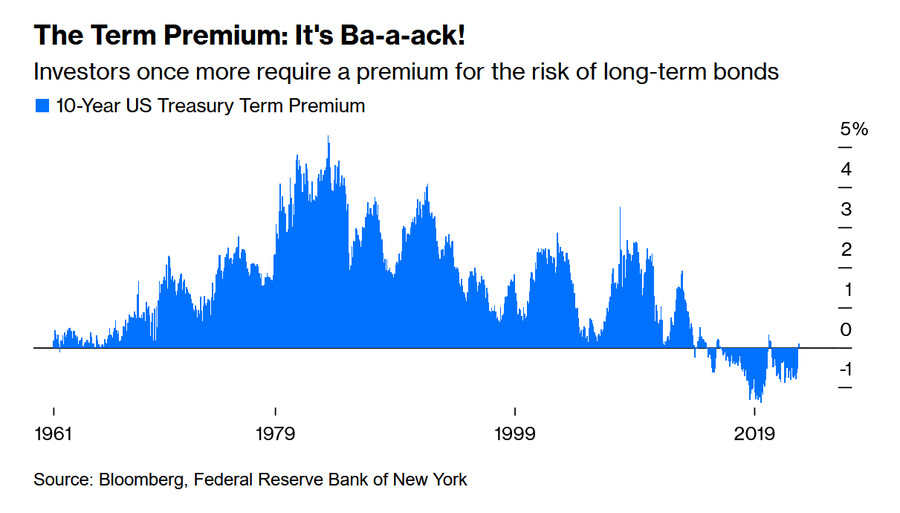
Driving the latest scare is the rising term premium, which is often described as the additional yield investors require to hold longer-dated securities, given the extra uncertainty over such extended periods. According to estimates by the New York branch of the Federal Reserve, the premium on ten-year bonds has risen by 1.2 percentage points from its lowest level this year, more than explaining the recent surge in long-term yields.

In truth, though, the term premium is a nebulous thing, and must be treated with caution. It cannot be measured directly. Instead, as with a surprising number of important economic phenomena, analysts have to tease it out by measuring more concrete parts of the financial system, and seeing what is left over. Estimating the premium for a ten-year bond requires forecasting predicted short-term interest rates for the next decade, and looking at how different they are from the ten-year yield. What remains—however large or small—is the term premium.
The difficulties do not stop there. John Cochrane of Stanford University’s Hoover Institution points out that, although risk premiums might be more easily estimated at relatively short maturities, the calculations require more and more assumptions about the future of short-term interest rates as analysts move along the curve. When estimates of the term premium are published, they are not typically accompanied by a margin of error (오차 범위). If they were, the margins would get progressively wider the longer into the future the forecast was conducted.
There is also surprisingly little history from which to draw when making assessments of changes in the yield curve or term premium. In the past 40 years, there have been perhaps eight meaningful periods of bear steepening, and only in three of them was the yield curve already inverted. The three instances—in 1990, 2000 and 2008—were followed by recessions, but with widely varying lags.
Movements in bond markets are therefore both easy and difficult to explain. They are easy to explain because any number of factors could be driving yields, including the Fed’s quantitative-tightening programme, concerns about the sustainability of American debt and worries of institutional decay. Yet attributing bond yields to one factor in particular is fraught with difficulty. And without more clarity on the causes of a move, inferring the future from the shape of the yield curve becomes more like reading tea leaves than a scientific endeavour.


One thing is certain, however. Whatever their cause, and regardless of their comp-osition, rising long-term bond yields are terrible news for American companies that wish to borrow at long time horizons, and borrowers who take out new mortgages that will be linked to 30-year interest rates. The effect on the most sensitive borrowers will become only more painful if yields with long maturities remain at such high levels. For anyone concerned about whether a shifting yield curve or a rising term premium signals a looming recession or a nightmare for markets, these simple realities are a better place to start.■
user error : Error. B.