-
[금융/시황/전략] (블룸버그) 금리 인하 기대했던 시장, 뜨거운 CPI로 낙관론에 경고음2024.02.14 PM 08:52
블룸버그 칼럼 요약
1) 예상보다 뜨거웠던 1월 CPI의 여파
美 1월 CPI 예상치 상회 → 경기 과열 우려 → 조기 금리 인하 기대감 ↓
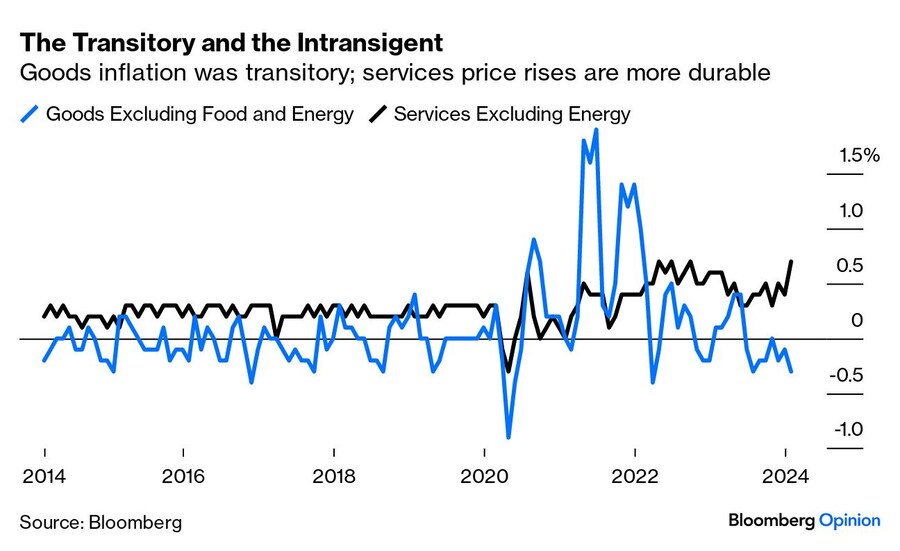
팬데믹 발 공급망 교란으로 급등했던 상품 인플레이션은 하락 추세
반면 서비스 인플레이션은 여전히 팬데믹 이전보다 높은 수준
서비스 인플레를 주거비와 슈퍼코어(주거비를 제외한 서비스 물가)로 분류해서 살펴 보면
슈퍼코어 인플레는 상승 중
주거비 디스인플레이션은 실시간 임대료에서 예측되는 것보다 느리게 진행 중

슈퍼코어가 중요한 이유는 임금과 밀접한 관련이 있기 때문
인플레이션이 시작되던 2021년 당시 제기됐던 우려
상품 인플레 → 임금 인상 요구 ↑ → 서비스 인플레 → 기대 인플레 ↑
1월 CPI는 이런 우려가 현실이 될 수 있다는 것을 보여줬음
이런 인플레 고착화 우려에 대한 반론도 있음
주거비 인플레는 과장되었고, 서비스 인플레는 금융 서비스 비용 때문에 부풀려 졌다는 것
주가 강세 → 주식 거래 수수료 ↑ → 금융 서비스 비용 ↑
하지만 1월 CPI를 그저 튀는 데이터로 치부하는 것은 위험
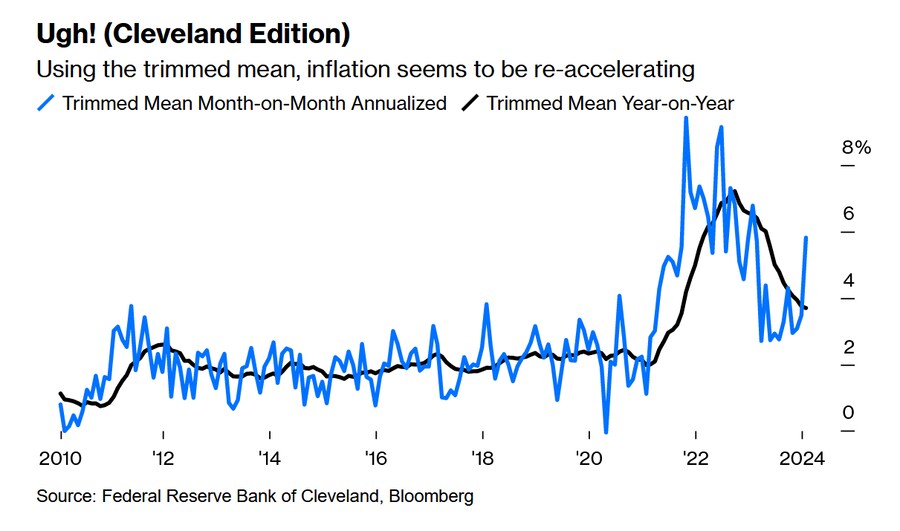
클리블랜드 연은 절삭 평균 물가 지수 (극단적인 값 제거)
→ 전년 대비 4% 조금 못 미치는 수준, 3개월 연율화로는 재가속

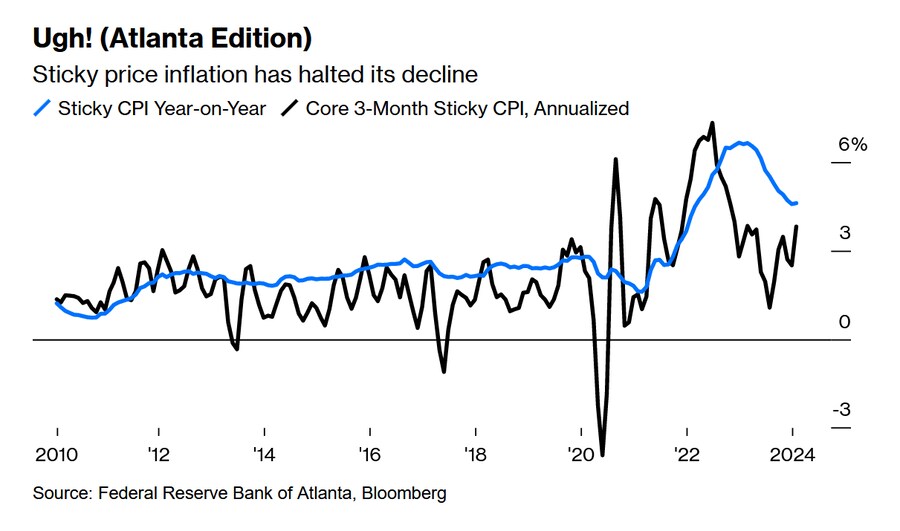
애틀랜타 연은 비탄력적 물가 지수 (한 번 올라가면 가격이 쉽게 바뀌지 않는 품목들)
→ 전년 대비 하락세 멈춤, 3개월 연율화 반등
→ 인플레이션 고착화 우려
이 모든 수치가 엄청나게 높은 수준은 아니지만 경기 과열 우려는 여전히 존재
CPI와 다른 방식으로 계산되는 PCE로 보면 기준 금리 인하는 가능할 수도 있음
하지만 연준이 경기 과열을 막기 위해 과잉 긴축 끝에 경기 침체를 부를 가능성도 있음

시장의 기준 금리 전망은 조기 금리 인하 기대감을 대부분 되돌렸음
연준이 고금리를 장기간 유지할 것이라는 심리가 정점에 달했던 2023년 10월 18일 수준에 근접
또한 12월 FOMC에서 발표했던 기준 금리 전망(점도표)와 비슷한 수준으로 근접
기준 금리 인하 기대감 후퇴는 채권 시장에도 반영됨
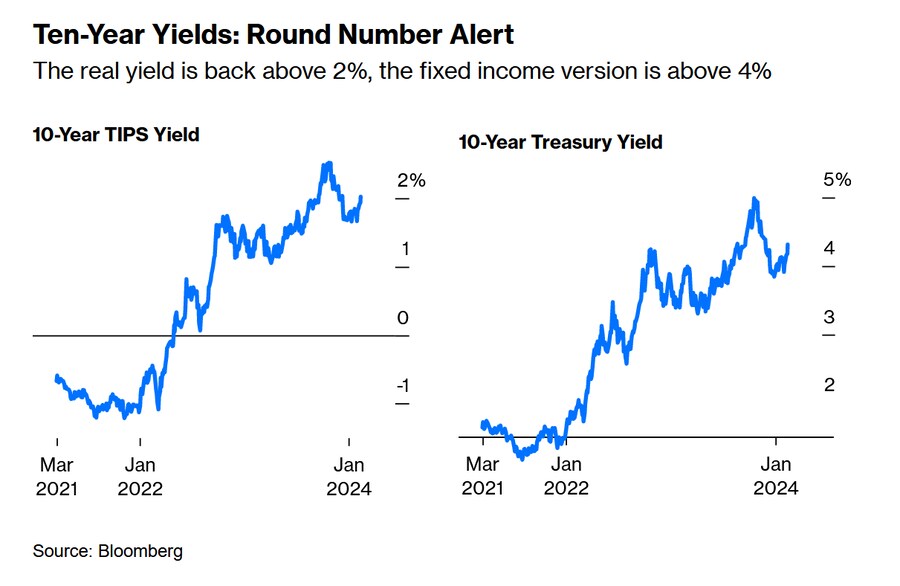
10년물 TIP 국채 금리는 2% 이상으로 상승 (TIPS 금리 = 실질 금리)
10년물 국채 금리는 4% 이상으로 상승
2) BofA 글로벌 펀드 매니저 설문 조사 (FMS)
시장이 전반적으로 낙관적인 모습으로 복귀
이것은 시장이 하락할 수도 있다는 신호
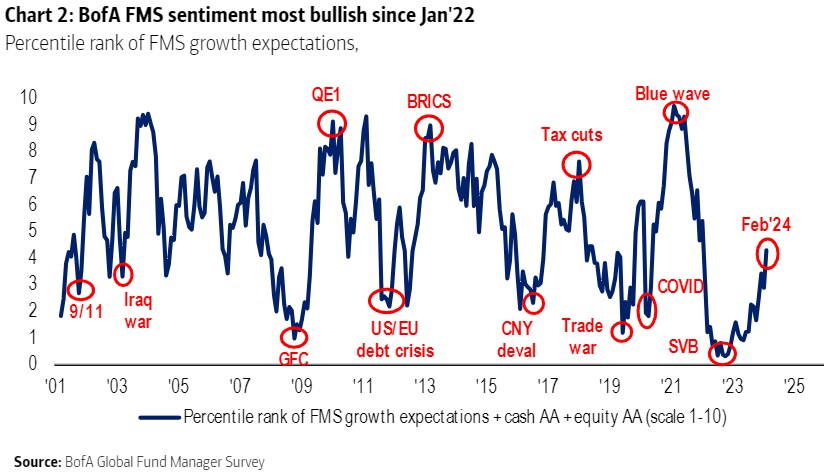
투자 심리는 작년부터 빠르게 회복
그러나 아직 극단적인 낙관론과는 거리가 있음
이렇게 낙관론이 팽배한 상황에서 뜨거운 CPI 데이터로 인해 채권 금리가 치솟자 주가는 급락
하지만 화요일 장마감 시간이 다가오자 저가 매수세가 유입되며 하락폭을 일부 만회
사실 작년 10월부터 시작된 주가 상승 추세는 아직 깨지지 않았음

하지만 인플레이션에 대한 우려가 여전하다는 것은 중요함
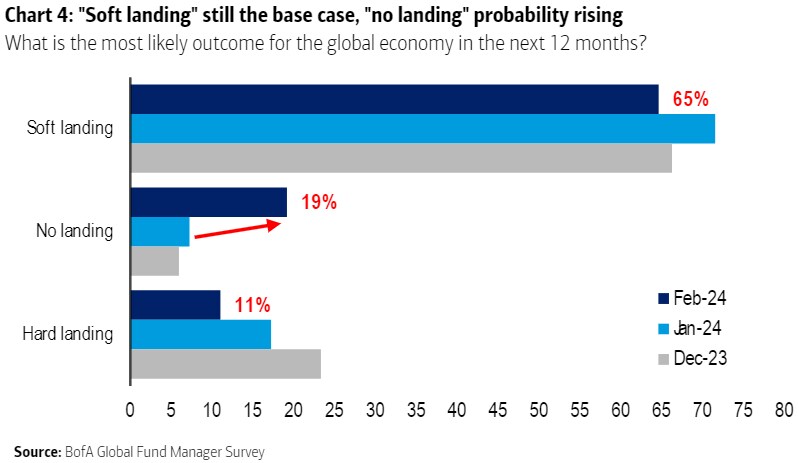
BofA 설문 조사에 응답한 펀드매니저의 대부분은 연착륙이 가능하다는 의견
하지만 그 가운데 상당수(19%)가 노랜딩이 가능하다고 생각 (작년 말보다 크게 증가)
이와 더불어, 1월 CPI는 경기 과열이 시장의 가장 큰 우려라는 생각을 뒷받침
시장이 포지션을 조정하여 경기 과열 위험에 대비하지는 않았지만 그런 위험을 인지하고 있었다는 것을 FMS는 보여줌 (노랜딩 의견)
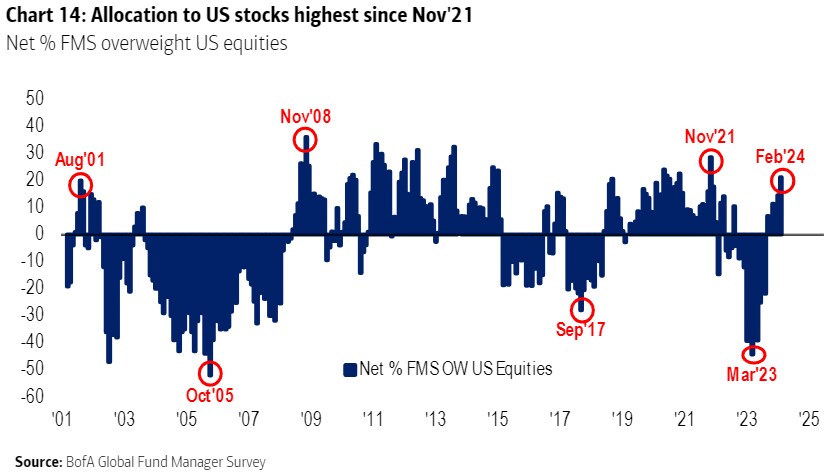
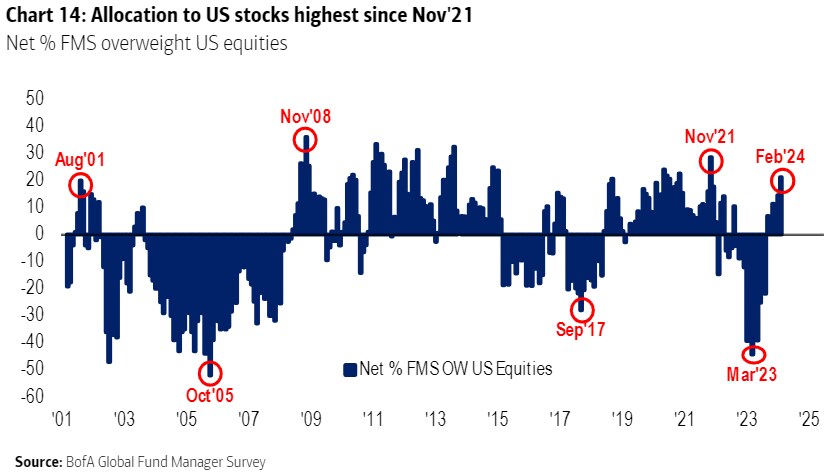
연착륙에 대한 낙관은 미국 주식 비중 확대로 이어졌음
3월 지역은행 사태 이후 투자 심리 개선은 놀라울 정도 (미국 주식 비중 ↑)
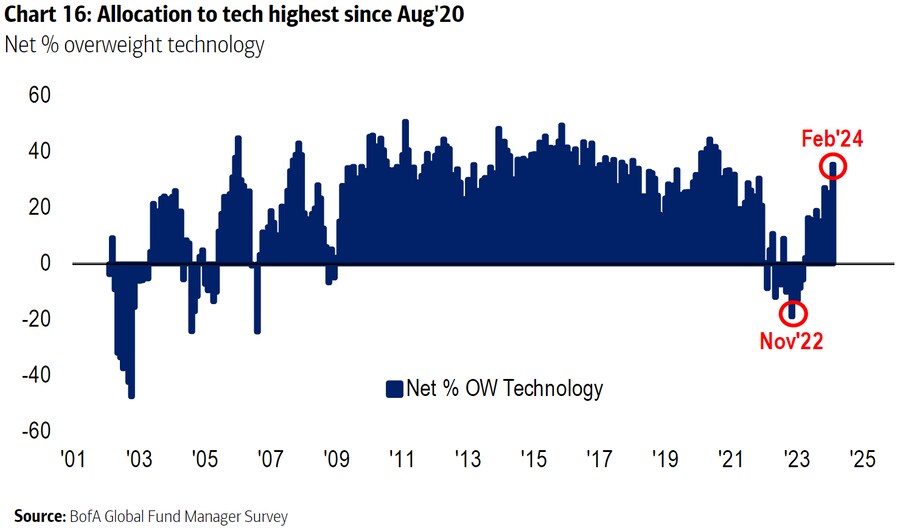
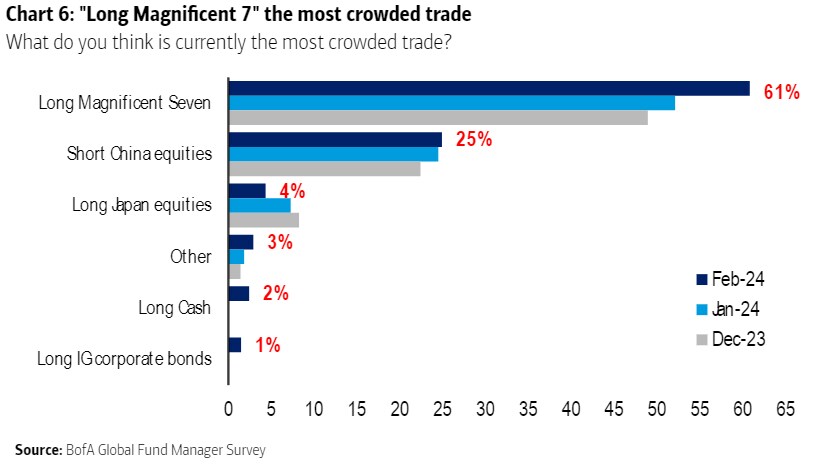
펀드매니저들은 매그니피센트 7을 가장 붐비는 거래로 뽑았음
그럼에도 그들은 이들 대형 기술주에 대한 비중을 크게 늘렸음
대형 기술주에 대한 열광이 화요일 주가 급락을 부른 원인 가운데 하나
엔비디아를 제외한 나머지 종목들은 급락

(매그니피센트 7은 아니지만) ARM의 주가는 터무니 없을 정도로 크게 출렁였음
긍정적 실적 발표로 30% 폭등했지만 CPI 발표 이후 20% 급락
시총이 1230억 달러인 대형주가 이런 움직임을 보이는 건 극히 드문 일
기술주에 약간의 거품이 낀 것은 확실해 보임
인공지능 종목에 투자자들이 지나치게 많이 몰리고 있음

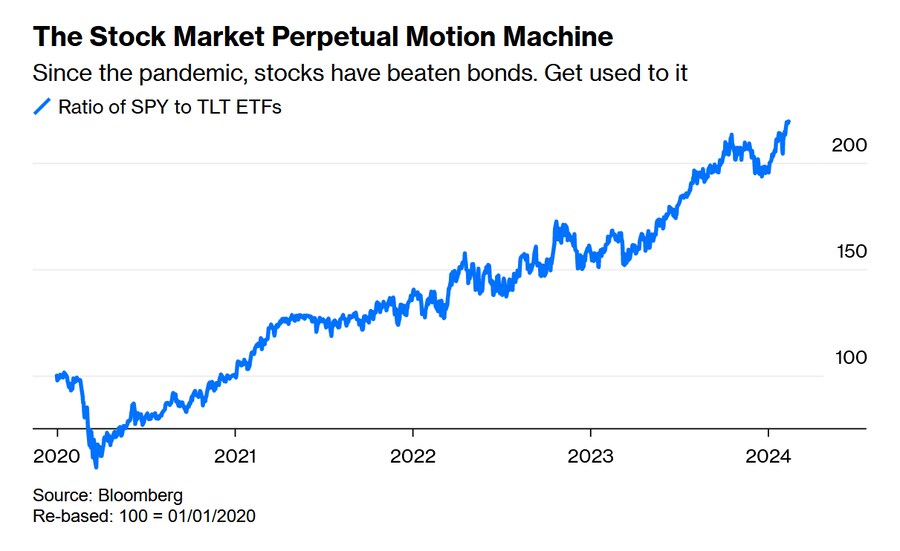
하지만 중장기적으로는, 연준이 고금리를 오래 유지할 위험은 주식보다 채권에 부정적
경기 과열은 기업 매출에는 긍정적이기 때문
그래서 장기 국채 대비 S&P 500의 상대적인 강세는 아직도 유지되고 있음 (SPY/TLT)
이런 시나리오가 사실인지 확인해 줄 수 있는 데이터들이 이번 주에 발표 예정
경기가 지나치게 좋다면 이는 소매판매(목요일), 생산자물가(금요일)에 반영될 것
이런 데이터가 발표되기 전까지는 현재 시장의 포지션은 합리적으로 보임
이런 상황에서 연착륙 또는 경기과열 시나리오 가운데 하나에 너무 큰 금액을 베팅하는 것은 현명하지 않은 선택
======================================================
(Bloomeberg) First There Was Transitory. Now Comes Intransigent
The stubbornness of sticky prices fueled partly by rising wages is what the Fed feared from the outset. It’s happening.
2024년 2월 14일 오후 2:01 GMT+9
By John Authers
John Authers is a senior editor for markets and Bloomberg Opinion columnist. A former chief markets commentator at the Financial Times, he is author of “The Fearful Rise of Markets.”

Workers are making demands for higher wages stick, and prices are getting stickier, too.Photographer: Taylor Glascock/Bloomberg
Today’s Points:
● US inflation data were a bona fide nasty surprise, suggesting a risk of overheating.
● There may be some quirks in the data, but not enough to overturn broad conclusions.
● That’s because measures excluding outliers, and focusing on the stickiest prices, are turning upward.
● Most of the bond market’s shift since the “Powell Pivot” has now been reversed.
These Numbers Were Too Hot to Handle
Goldilocks should be careful so she doesn’t burn her lips. After a startling US inflation report for January, it’s plain that her porridge isn’t too cold, at least not yet — but it very well might be too hot. That led to an interesting readjustment on markets, as traders pondered the possibility that Team Transitory hadn’t been right after all.
The debate throughout 2021 was whether the inflation then taking hold was truly “transitory” — driven by temporary supply blockages caused by the pandemic — and would come down without the help of hawkishness from central banks. Team Transitory lost that battle, but they certainly had a point that much of that extreme spike was indeed short-lived. That shows up if we compare month-on-month rises in goods (excluding always erratic food and energy) and services. Goods suffered a huge shock that is now over; services inflation, however, has moved to a level notably higher than before the pandemic. Goods inflation fell last month, while services rose:

To illustrate how the price-shock pig worked its way through the python, the following screenshot from the Bloomberg terminal’s ECAN

It’s the month-on-month figures that show the problem clearest. On a year-on-year basis, services inflation is coming down, though a little disappointingly slowly. Month-on-month, it’s back close to its peak:

Breaking down the sector into shelter (whose measurement grows ever more controversial as it accounts for a bigger share of overall inflation), and the Federal Reserve’s so-called “supercore” measure of services excluding shelter, we find that the supercore is rising, while the disinflation of shelter (which should be in full swing now, to judge from real-time indexes of new leases being signed) is proceeding slowly:
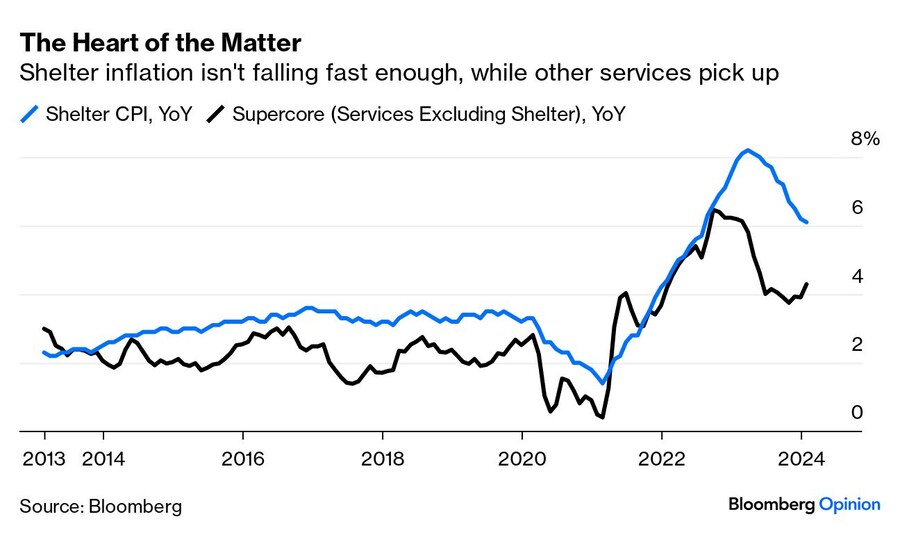
Supercore matters to the Fed because it is particularly sensitive to wages. The salary bill is a large part of a service company’s budget, much of it paid to relatively lowly paid workers. The concern as inflation took hold in 2021 was that the fast inflation of the goods that people needed to buy would prompt stronger wage demands. That would push services inflation upward, and risk embedding higher expectations. The January numbers suggest that that’s exactly what is now happening.
There are arguments to be made against this. Shelter inflation is probably overstated, while the overall services number may be inflated by financial services, which is affected by the level of the stock market — when equities have had a rally, as now, that will tend to increase the fees charged in the financial sector.
However, it would be dangerous to dismiss January as a quirk. More sophisticated statistical measures carried out by different research groups within the Fed confirm a picture of rising, not falling, inflationary pressure. The Cleveland Fed’s trimmed mean, which excludes the biggest outliers in either direction and takes the average of the rest, saw its biggest rise last month since early in 2023. The overall year-on-year measure is barely below 4%. So this can’t be attributed to some quirky outliers:
The Atlanta Fed keeps an index of sticky prices, for goods and services whose prices take a long time to change and tend not to go down. As a rule, it’s when this number develops momentum that central banks need to fear that inflation has become engrained again. And over the last three months, sticky price inflation has picked up. The decrease in the year-on-year measure has stalled:

None of these numbers suggests disaster, or anything like it. But they clearly suggest that it would be premature to declare victory. And they deepen the quandary for the Fed’s policymakers. On these figures, it would be foolish to cut. The Personal Consumption Expenditure number, separately calculated and not yet available for January, suggests price rises are lower, particularly in services, and implies that cuts might already be possible. Further hikes are hard to imagine unless the PCE shifts hard upward, but the risk of overheating or “no landing” (in which the economy carries on strong and eventually forces the Fed to tighten until it forces a recession) looks significant. “Is the Fed too tight?” asks Steven Blitz of TS Lombard. “Current data say no, future data are unclear. Hedging their bet, the Fed holds back on cutting and communicates easing. Inflation lurks.”
The numbers produced a sharp change in fed funds forecasts as measured by Bloomberg’s World Interest Rate Probabilities function using fed funds futures. The chart below shows the projected path for fed funds at three points: Oct. 18, 2023, which we now know was when “higher for longer” sentiment peaked, Jan. 12 of this year, when belief that the Fed had made a decisive pivot toward cutting reached its own peak, and at Tuesday’s close of trade after the January CPI. The projected flight path now is much closer to the one that was predicted last October than to the model dominating traders’ hopes a month ago. It’s also moving closer to the Fed’s own current predictions published in its so-called “dot plot” of economic projections last December.

Meanwhile, that view of the Fed is also expressed in the bond market, which saw a major selloff. The yield on 10-year Treasury Inflation Protected Securities (TIPS) has gone back above 2%, while the benchmark 10-year nominal rate is now firmly above 4% again. Both are very much higher than would have been predicted a year ago, and much closer to the top of their recent range than the bottom:

And then there’s the matter of how this all played out in the stock market…
The Thundering Herd Was Bullish
Handily, the latest monthly survey of global fund managers from Bank of America Corp. was published only hours before the CPI data changed some assumptions. Overall, bullishness was back, which is always a cautionary signal that the market is setting itself up for a fall:

This measure is smooshed together from BofA’s readings on how heavily managers are allocated to cash and to equities, and on their growth expectations. It shows a sharp improvement in the last year, which has been mirrored in the surge in stock markets, but it’s still a long way short of previous extremes. The bullishness ahead of the CPI number looked premature; it didn’t look crazy.
With investors so bullish in advance, and with bond yields rising sharply, it’s no surprise that stocks had a bad fall. For the time being, though, that drop doesn’t look excessive. Bottom-pickers were already trying to buy bargains by the end of Tuesday’s trading, and the day follows a protracted rally with no pullback of any significance since sentiment on rates suddenly shifted last October. As the lines I drew on this terminal chart show, the upward trend in force since then remains intact:

But it’s important that concerns about an inflation report like this were definitely present. Belief in a possible soft landing for the economy remained dominant, according to BofA, but a sizable minority (19%) rated “no landing” as their base case. That is up sharply from the turn of the year, and the new inflation data will tend to confirm and reinforce those who think that overheating is now the greatest concern. While traders weren’t p-ositioned for what happened, they have been waking up to the risk of overheating:

The soft landing hopes did, however, contribute to heavy p-ositioning in US equities. It’s startling how much sentiment toward the US has turned around since the brief regional banking crisis last spring:
As for distribution within stocks, the belief that the Magnificent Seven have become the most crowded trade on the planet has grown overwhelming, with 61% naming it. This hasn’t, in aggregate, stopped plenty of fund managers from piling into the stocks and worsening the problem:
Indeed, they’re back to being as overweight in technology, compared to their benchmarks, as they have been in years:

The real consequences of the excitement over Big Tech were on full display. With the partial exception of Nvidia Corp., which remained unchanged, the Magnificent stocks all fell heavily. Most spectacularly (though it’s not one of the Seven), ARM Holdings Plc, the UK-based semiconductor manufacturer that recently listed in the US, endured absurd turbulence in the backwash from an earnings announcement last week that was perceived as showing that it was well p-ositioned to benefit from artificial intelligence. By Monday lunchtime, it was up more than 30% for the day; it tanked at the open on Tuesday, after the CPI numbers, and by close of trade was down for the week. Trading activity like this in a large company (its market cap at the close was $123 billion) is very unusual. There’s certainly some froth, and there’s definitely too much of a crowd in AI stocks:

In broader perspective, however, worries about “higher for longer” rates would tend to be worse for bond prices than for stocks. Thus stocks reached a new high relative to bonds (as proxied by the most popular exchange-traded funds for the two asset classes), even as the S&P had a bad day. This is a startlingly strong trend that has persisted almost uninterrupted since the worst days of the pandemic in 2020:

For the medium term, a no-landing possibly followed by more rate hikes would be awful for bonds, while equities would at least be helped by rising corporate revenues. And there’s plenty more data this week that could change the base case yet again, or confirm us in our fear of overheating. If the economy is really moving too fast for its own good, that would show up in retail sales (due Thursday) and producer prices (due Friday). While we wait, the current market p-ositioning seems sensible. It would be unwise to make too big a bet against either a soft landing or an overheat.