블룸버그 기사 요약
미국 국채 금리는 정점을 지났는가?
1) 장기적 관점
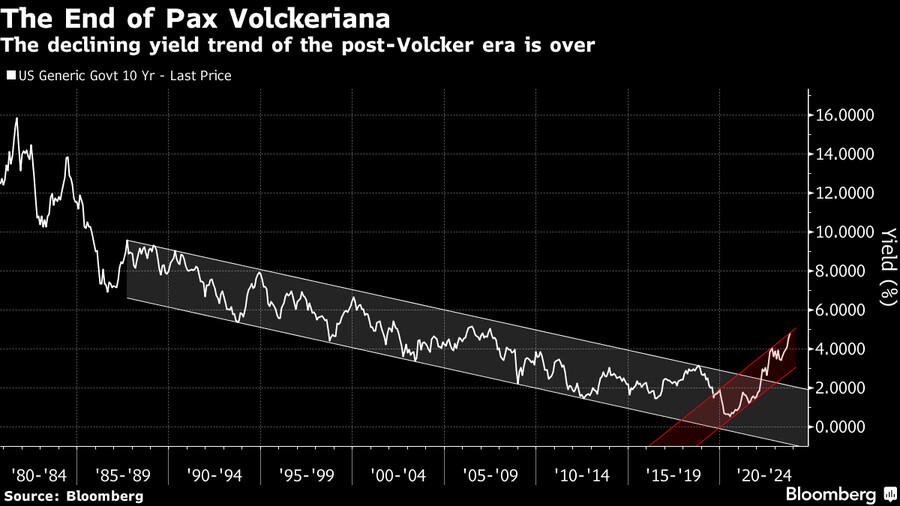
폴 볼커 연준 의장 이후 30년 이상 유지되던 금리 하락 추세는 팬데믹 시대의 제로 금리를 끝으로 반전됐음
인구 고령화, 세계화 시대 종료로 인한 임금 상승 등이 원인
2) 단기적 관점 (앞으로 며칠에서 몇 주 사이)
금리가 단기 고점을 지났음을 알려주는 징후들
① 기술적 분석
국채 시장에서 블로 오프 탑(Blow-off top·끝물 장세)이 발생했을 가능성
가격과 거래량이 가파르게 급등한 뒤 더 큰 폭의 급락이 뒤따르는 현상
② 채권 시장
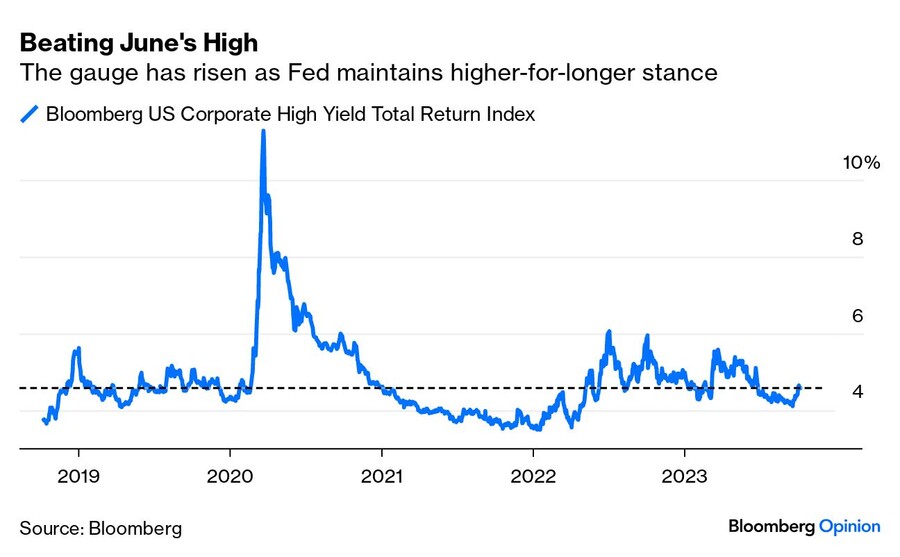
하이 일드 스프레드 (하이일드 채권과 국채 금리 간 격차) 6월 이후 최고
물론 스프레드는 아직까지 매우 낮은 수준
그럼에도 불구하 재무제표가 취약한 기업들의 주가는 높은 부채 비용과 고금리로 인해 압박받고 있음
고금리가 길어질수록 가계, 기업, 정부가 고비용 재융자 위험은 커질 것
지금은 변동금리 대출자들이 고통받고 있지만, 재융자 시기를 맞는 고정 금리 대출자가 증가할수록 금리 부담은 더욱 커질 것
③ 소형주
중소 기업은 변동 금리 부채가 많기 때문에 고금리에 취약할 수밖에 없음
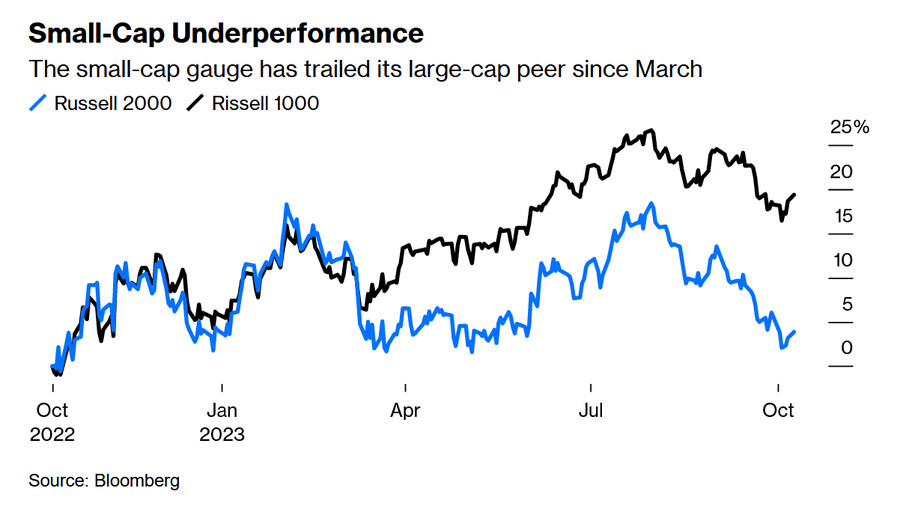
이미 소형주는 대형주 수익률에 크게 뒤쳐지고 있음
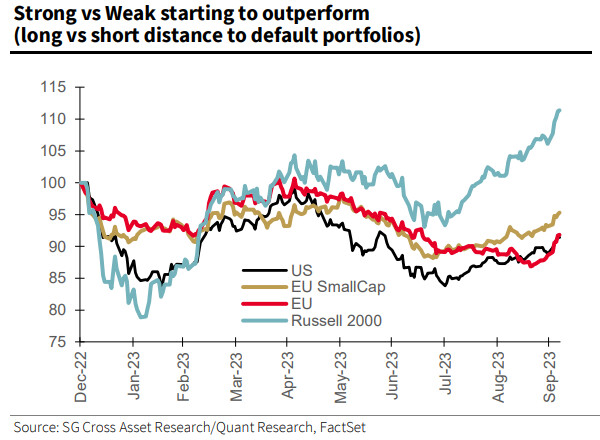
미국 소형주 가운데서도 재무제표가 탄탄한 종목들은 그렇지 않은 종목들을 현저히 앞서기 시작했음
④ 금융 여건
채권 금리 상승은 금융 여건 긴축으로 이어졌음
이렇게 되면 뭔가 부러지면서 금리가 정점을 찍고 하락하는 경향이 있음
⑤ 연준의 스탠스
최근 연준 인사들이 금리 인상 중단 가능성을 시사
그들은 높은 채권 금리가 금융 여건을 긴축시켜서 연준의 금리 인상 필요성을 줄인다고 언급
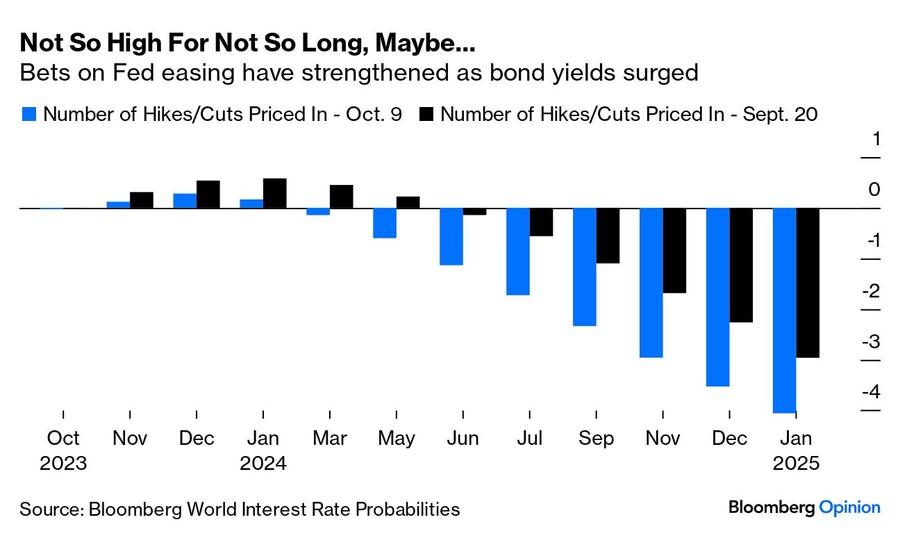
시장도 이에 동의하고 있으며, 이는 연방 기금 금리 선물 시장에서 내년 금리 인하 예상폭이 커진 것에서 알 수 있음
연준은 금융 여건이 너무 빨리 긴축되는 것에 겁을 먹음
이를 막기 위해 연준 인사들은 금리 인상이 막바지에 도달했다는 신호를 보냄
시장은 이를 기준 금리 인상 종료 및 인하 가능성으로 받아들고 있음
금융 시장이 연준의 통화 정책을 왜곡해서 해석하는 것일 수도 있지만, 적어도 당분간 국채 금리는 안정되면서 신용은 긴축될 것이라고 보는 것이 합리적
================================================
The secular trend that led to ever-lower bond yields starting in the 1980s has ended. How long this new regime will last isn’t yet written.
2023년 10월 10일 1:31 GMT+9
By John Authers
John Authers is a senior editor for markets and Bloomberg Opinion columnist. A former chief markets commentator at the Financial Times, he is author of “The Fearful Rise of Markets.”

Paul Volcker, pictured above in Singapore in 2010, set monetary conditions on course for decades. That era is over.
Photograph: Bloomberg
Is This It?
Could the worst be over? Treasury yields have dropped with a resounding thud as they reopened after a long holiday weekend in the US, with the benchmark 10-year falling some 17 basis points. Is it possible that we have seen the peak in bond yields? There’s a case to argue that we have — but, as always in the bond market, you have to be very careful to stipulate the time period.
For the short-term, it looks as though yields may be heading down. That has no effect on what seems to be transpiring for the longer term, which looks like a true regime change. Let’s start with the long-term and then narrow down to the next few weeks.
Secular Transition
For decades, the financial world lived in Pax Volckeriana. That now seems to be at an end, much like the vaunted Pax Americana in which the US was the global police officer.
After President Richard Nixon severed the Bretton Woods tie between the dollar and the gold price in 1971, world markets endured a decade of chaos. That was lanced by the Federal Reserve under Paul Volcker, who effectively replaced gold with the concept of Fed credibility. By showing that he was prepared to force the US into recession if necessary to control inflation, he was able to keep the dollar as the trusted center of a global financial system, even though it was no longer backed by gold. That enabled a steady and inexorable downward trend in 10-year yields that endured for more than three decades.
There are plenty of ways to track the trend, but the lines I’ve drawn on this Bloomberg terminal chart are as good as any. They start from the Black Monday crash in October 1987, which itself took place just after Volcker had departed the Fed. The 10-year yield went through a series of cycles, hitting successively lower peaks that each created difficulties, but the direction was down. That seems unequivocally to have ended in the throes of the pandemic, when yields were forced to almost zero. Since then, a new upward trend seems to be taking shape — and to be clear, I am certainly not trying to claim that we will now have three decades of rising yields, but merely that the previous regime is over:
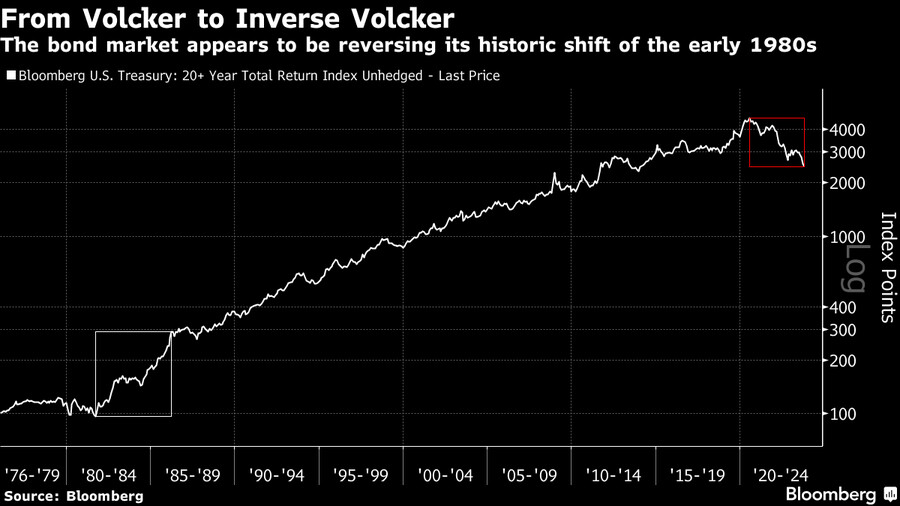
We can look at the same phenomenon another way via the return that bonds would make for you. The following chart shows Bloomberg’s index of Treasury bonds dated 20 or more years into the future. Viewed this way, on a log scale, we see a dramatic uplift in the early 1980s, as Volcker gets to work, but the chart is book-ended with a decline almost as pronounced that starts in 2020. In Jerome Powell’s speech at that year’s Jackson Hole symposium, he announced a review of monetary policy that revealed him in some eyes as an “Inverse Volcker” determined to do what it took to bring inflation back.
Looked at either way, the secular trend appears to be over. This deviation is too great to be treated as another cyclical oscillation as the regime continues unchanged. There are plenty of reasons why this might be so, from the growing population of the elderly through to the end of the globalization shock to wages that will likely push inflation up to a higher level (and therefore require higher yields and interest rates). But the regime has changed. Bear this in mind as we narrow the focus on to the next few hours, days and weeks.
Cyclical
If this were the top of a bond yield cycle, like the many during Pax Volckeriana, what would we expect to witness in other financial markets to confirm it?
Technical Patterns
At a technical level, we might expect a “blow-off” top, and we might just have seen that. To quote Chris Watling of London’s Longview Economics, this is when prices move “away from fundamentals and (are) technically driven by capitulation” both by those who have been long Treasuries as well as over-leveraging of short p-ositions by momentum traders. This is all in line with the famous “Elliott Wave” school of technical analysis. “Herd behavior and capitulation drive a sudden dramatic final move. In that framework, therefore, this is the final move in yields to the upside.”
Effects on Credit
Beyond patterns within the bond market itself, we can also look out for cues in other markets. Citi’s cross-asset strategy team issued some research on this last week, when there was another leg upward still to come. At the top, strategist Dirk Willer explained, there is “almost always” a downward trend in the oil price (which happened very strongly until the bounce after the news from Gaza), and this feeds through to shorter-term inflation breakevens, which have remained subdued. He adds:
"There is also a top in cyclical versus defensive sector outperformance. Economic surprises tend to start to disappoint and bond volatility moves up into the peak but then mean-reverts. High probability of default companies also tend to underperform into the peak, which continues, as credit spreads deteriorate past the peak in yield."
Last week’s unemployment data showed that economic surprises haven’t turned negative yet. But the behavior of companies with a high probability of default is exactly in line with what we might expect ahead of a peak. Bloomberg US Corporate High Yield Total Return Index, which tracks high yield, fixed-rate corporate bond markets, has seen its spread over equivalent Treasuries hit its highest since June. Spreads remain very low, however. The idea that they could widen significantly as the peak in Treasury yields is reached would make sense:
Meanwhile, even if their bonds aren’t suffering much, the stock of companies with weak balance sheets is now increasingly being stretched by higher debt loads and higher interest rates. The risk of refinancing is going to be a major topic over the coming years as governments, corporates and individuals face the consequences of a considerably higher cost of money, said Societe Generale strategist Andrew Lapthorne. “Those with floating-rate instruments are already feeling the pain, but as more fixed-rate debt starts to roll over, we would expect a negative feedback loop to develop,” he wrote.
Small Caps
And those that face the biggest risk? Small caps, which they said may reduce duration or go floating rather than lock in higher rates for the longer term. “This of course assumes that today’s rate environment is temporary, which is why markets become alarmed when there is economic data to the contrary,” they added. Small caps are indeed beginning to sharply underperform larger companies:
Within small caps in the US, companies with strong balance sheets (as measured by their distance to default) have begun to outperform very significantly in the last two months, as this chart from Lapthorne shows. This is what we might expect to see at a peak for Treasury yields:
Companies in 2021 did a “very good job” extending maturities to 2024 to 2025 when rates were near zero, said Raphael Thuin, head of capital markets strategies at Tikehau Capital. But now they face an impending problem. “There is a wall of maturities to refinance and you have to refinance with much higher rates and much less liquidity,” he said. “Europe has had a more difficult hand to play with,” given the worse inflation scenario in the region. This is illustrated in another chart from SocGen’s Lapthorne:
For now though, there are limited signs of stress in the corporate debt market because there have so far been only limited refinancing needs, Tikehau’s Thuin said. “So right now companies didn’t really have to refinance that aggressively and so far they have been able to manage coming maturities with cash on hand.”
Financial Conditions
Rising bond yields, however, are contributing to a true tightening of financial conditions. It’s when finance is truly hard to come by that something tends to “break,” in the vernacular, and thereby cause bond yields to make a peak and decline. Goldman Sachs’s measure of US financial conditions (where anything above 100 is restrictive) suggests that financing remained far too easy throughout 2021, and also that the last 12 months have seen conditions get easier again. The latest bond spike has created the most restrictive conditions in 12 months:
Fedspeak
That tightening in financial conditions has in turn prompted a response from the single most important player in financial markets — the Fed. On Monday, Federal Reserve Bank of Dallas President Lorie Logan noted repeatedly that financial conditions had tightened and that the recent surge in long-term Treasury yields may mean less need for the US central bank to raise its benchmark interest rate again. Hours later, Fed Vice Chair Philip Jefferson said officials are “in a p-osition to proceed carefully in assessing the extent of any additional policy firming that may be necessary.” His key lines were:
"We are watching the tightening of financial conditions and the sharp increase in long-term real yields, and these developments are doing some of the hard work for us, and as such, we believe we have reached that fabled sufficiently restrictive level."
That seems to have been enough to convince many in the market that the Fed was sending a coordinated signal. In a nutshell, now that the markets had finally been so kind as to tighten conditions for them, the Fed might not need to keep rates quite so high for so long. “The markets all of a sudden are doing all the dirty work for the Fed,” Yelena Shulyatyeva, US economist at BNP Paribas SA, told Bloomberg News colleagues. “It seems like the majority, including some of the more hawkish policymakers, are OK with proceeding more cautiously.”
With the Treasury market closed for the federal holiday in the US, the clearest signal that the market agrees with this interpretation comes from the fed funds futures market. This chart shows the implicit predictions for the number of hikes or cuts of 25 basis points at every Fed monetary policy meeting between now and January 2025. The columns show the expected changes as of today, and the changes that were assumed on Sept. 20, when Powell’s press conference tipped the balance of opinion toward “higher for longer”:
Kevin Muir of the MacroTourist blog said:
"My suspicion is that they got scared that this was tightening financial conditions too quickly. They worried that if they didn’t alter their stance, it might feed on itself. So, they decided they were close to being done anyway, might as well signal that they are finished hiking. And make no mistake: That is what just happened… The Federal Reserve has just signaled that they have reached “sufficiently restrictive” and will be pausing here."
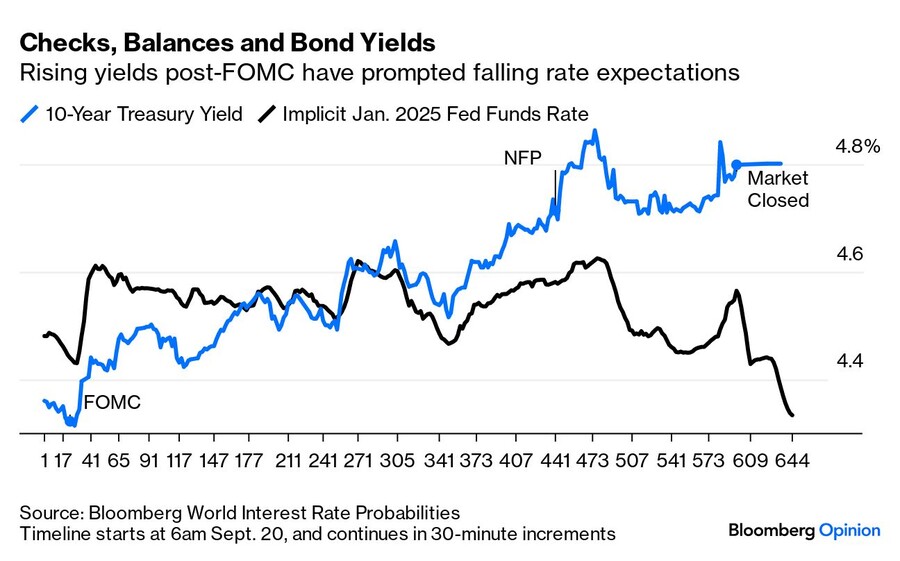
To illustrate that dynamic differently, this chart shows the implicit predicted fed funds rate for January 2025 and the 10-year Treasury yield since the morning of Sept. 20. The initial response was to push the projected fed funds rate up to 4.6%. But then the Treasury yield rose further while expected rates were little changed. Monday’s action suggested that confidence in the Fed to stay higher for longer is dwindling. That will put downward pressure on Treasury yields:
Now that the Fed is telling the market that it’s done the central bank’s job by tightening conditions, then, it looks like the market will take that as a cue to stop doing that job and ease them again. Such are the contradictions of monetary policy refracted through vast capital markets. But for now, it does make sense to expect bond yields to subside for a while, while credit at last begins to suffer.
—Reporting by Isabelle Lee


