블룸버그 기사 요약
Tipping Point?
지난 주에 있었던 일
① 재무부가 장기 국채 발행 규모를 축소
② 일본은행이 10년물 채권 금리 상한선을 올렸지만, YCC를 완전히 폐기하지는 않았음
③ 연준이 추가 금리 인상은 없을 것이라는 힌트를 줌
④ 미국 고용 데이터가 예상보다 약했음
①, ②, ③ : 중앙은행이 국채 금리 급등을 방관하지 않을 것이라는 의미
④ : 미국 노동 시장이 둔화되고 있으며, 이는 인플레를 잡기 쉬워진다는 의미
(예전에도 그랬듯이) 실업률이 상승하면 연준은 금리를 빠르게 내릴 수 있음
경제 데이터의 변화율은 경제/시장에 중요함
하지만 데이터 자체의 절대적 레벨도 중요함
실업률이 3.9%로 올랐고, 이는 작년 1월 이후 가장 높음
하지만 역사적 평균 대비 여전히 낮은 수준이며, 더 올라갈 여지가 있음
비농업 신규 고용은 여전히 평균적인 속도로 증가하고 있음 (물론 그 속도는 줄어들고 있지만)
(인플레이션에 직접적인 영향을 주는) 시간당 임금 상승률은 예상치를 소폭 상회
시간당 임금 상승률 4.1% (YoY)는 금융위기 이후 침체기 대비 높은 수준
최근 UAW 파업에 따른 임금 인상을 보면, 노동자들의 협상력은 여전히 강함 (적어도 지금은)
이는 시장에 딱히 긍정적이지 않지만, 임금 상승률이 하락 추세를 보이고 있는 것은 분명함
이에 대한 시장 반응
시장은 지난 여름 이후 유지되던 Higher For Longer에 대한 믿음을 버렸음
대신 내년부터 연준이 금리를 빠르게 내릴 것을 기대하고 있음
이로 인해, 10년물 국채 금리는 단기 지지선인 50일 이평선을 테스트 중
10년물 국채 금리가 앞으로 며칠 동안 계속 내리면, 상승 추세가 (적어도 단기적으로는) 꺾였다고 볼 수 있을 것
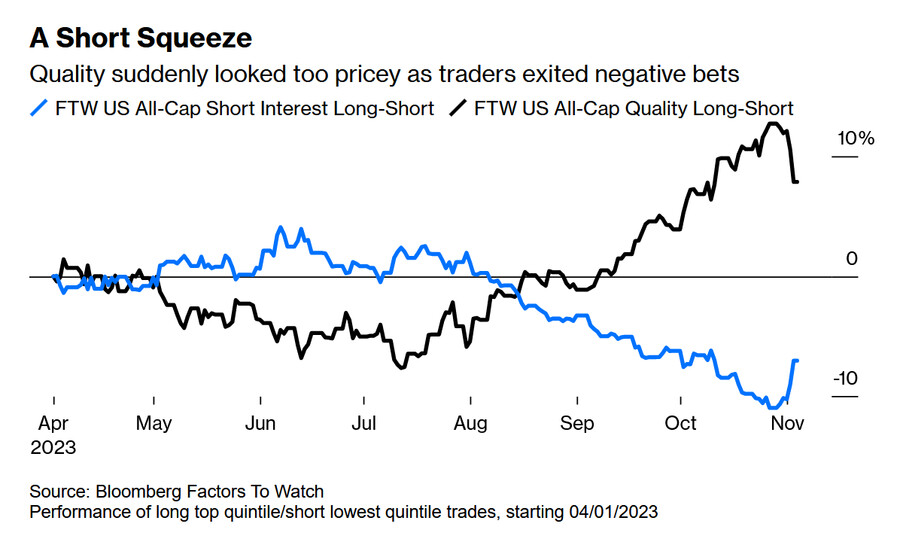
주식 시장의 수급은 고품질 종목(안정적 재무제표/꾸준한 실적)에서 공매도 과다 종목으로 이동
즉, 경기 침체를 예상하던 투자자들이 생각을 바꾼 것
자산 분배 관점 (주식/채권)
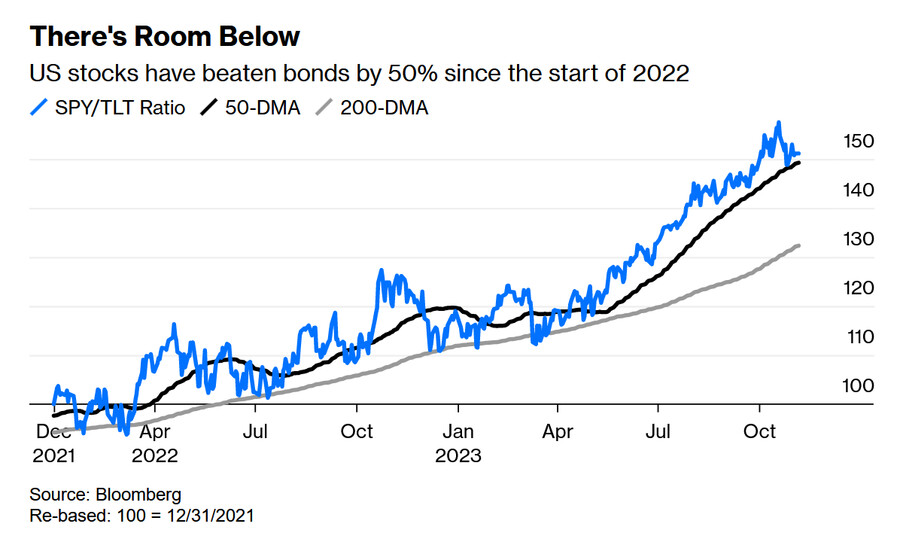
주식의 채권 대비 강세는 지속되고 있지만, 최근 채권 랠리로 SPY(S&P 500 ETF)/TLT(美 장기 국채 ETF) 비율이 단기 지지선으로 내려왔음
앞으로 채권이 랠리를 이어간다면, 주식의 채권 대비 강세가 약화될 수도 있음
채권 시장 반응
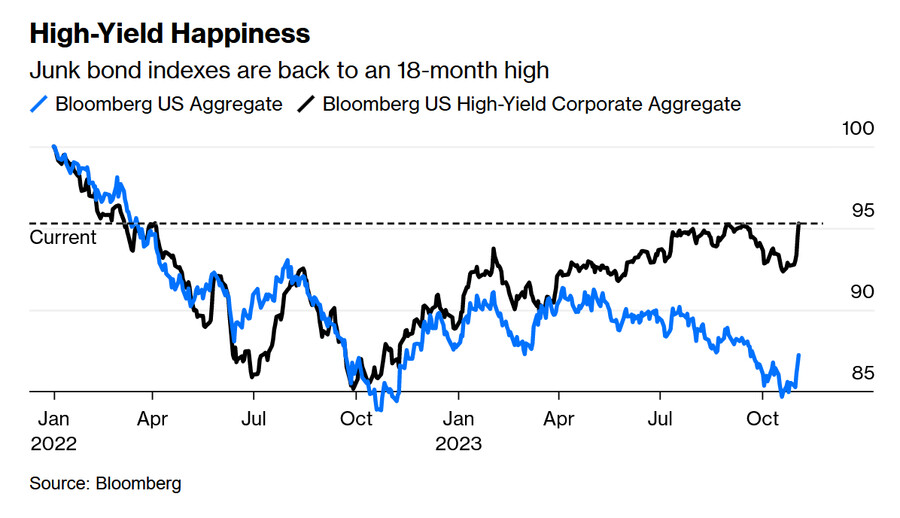
대출 기준 강화, 부도율/연체율 상승으로 인해 하락하던 하이 일드 채권 가격이 지난 4월 수준으로 반등
경기가 둔화하고 있다는 데이터가 나왔고, 금융 당국은 과잉 긴축을 걱정하는데, 투자자들은 투기적 채권을 매수
이런 모순적인 상황을 이해하려면, 현재 금융 여건이 어떤지를 알아야 함
Conditional Surrender
파월 의장은 국채 금리 상승이 연준이 해야할 일을 대신하고 있다고 언급
이는 기준 금리 인상의 필요성이 감소했다는 의미여서 투자자들은 환호
하지만 통화정책은 시차를 두고 실물 경제에 영향을 미침
18개월 동안 기준 금리를 올렸기 때문에, 금융 여건은 향후 18개월 동안 긴축될 수 있음
이는 경기침체로 이어질 수 있음
금융 여건이 긴축되면 금리를 더 올릴 필요가 없기 때문에 채권을 사는 건 모순임
채권 금리 하락(채권 가격 상승) → 금융 여건 완화 → 기준 금리 인상 필요성 ↑
시장이 금융 여건을 타이트하게 만들었다면, 마찬가지로 시장이 금융 여건을 완화시킬 수 있음
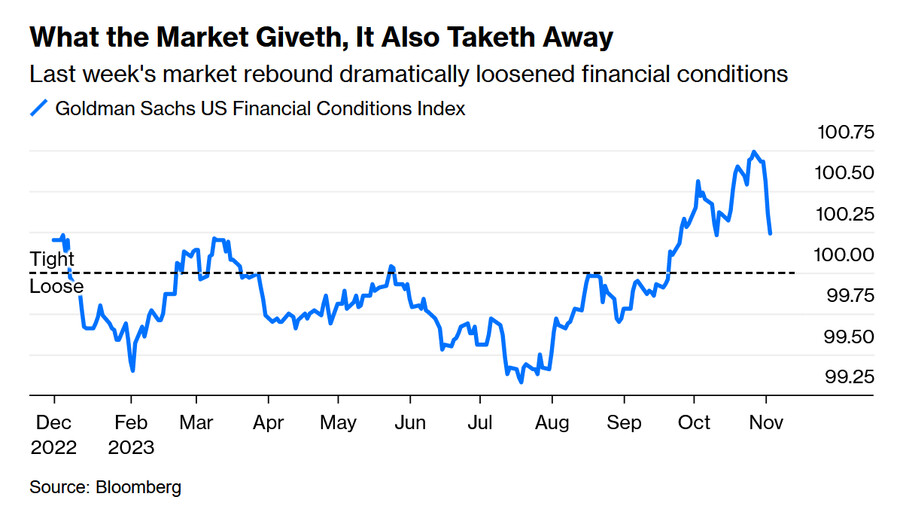
예를 들어, 골드만 삭스에 따르면, 지난주 중앙은행들의 완화적 발언 이후, 타이트하게 유지되던 금융 여건이 완화되고 있음
이것은 조지 소로스가 말했던 "재귀성"의 전형적인 사례임
→ 시장이 객관적인 사건을 반영할 뿐만 아니라, 자신만의 현실을 창조하는 능력
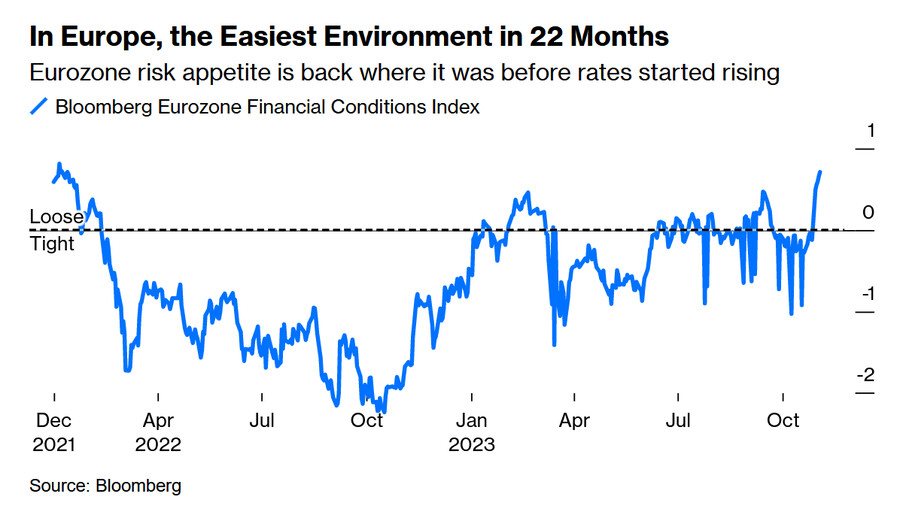
심지어, 블룸버그 집계에 따르면, 유로존의 금융여건은 금리 인상이 시작됐던 2021년 말보다 더 완화되었음
시카고 연방준비은행의 주간 국가금융상황지수(NFCI)에 따르면, 금융 여건은 50년 평균 대비 완화적임 (지난 주 초 기준)
→ 금융 여건을 구성하는 경제 데이터의 표준편차를 합산
→ 그래서 NFCI의 변동성은 낮은 수준임
→ 금융 여건은 완화적인 경우가 대부분이지만, 일단 금융 여건이 긴축되면, 극단적인 수준이 될 수도 있음
아직까지 통화 정책의 영향이 크지 않다는 의미
하지만 연준의 자체 집계에 따르면 금융 여건은 긴축적인 수준임 (지난 9월 말 기준)
→ 7가지 변수들을 경제에 미치는 영향을 기준으로 가중 평균하여 계산
→ 기준 금리, 국채 10년물 금리, 30년 고정 모기지 금리, BBB등급 회사채 수익률, 다우존스 지수, Zillow 주택 가격 지수, 명목 달러 인덱스
→ 이들 변수들의 지난 3년 간 변화율이 향후 1년간 GDP에 미치는 영향을 보여줌
Standard Chartered PLC의 Steven Englander는 연준 금융 여건 지수가 지금 어느정도 수준인지 추정했음
이에 따르면, 현재 금융 여건은 2008~2009년 금융위기 수준으로 긴축적이어서, 내년 GDP 성장률은 예상치 대비 1.1%p 감소할 것
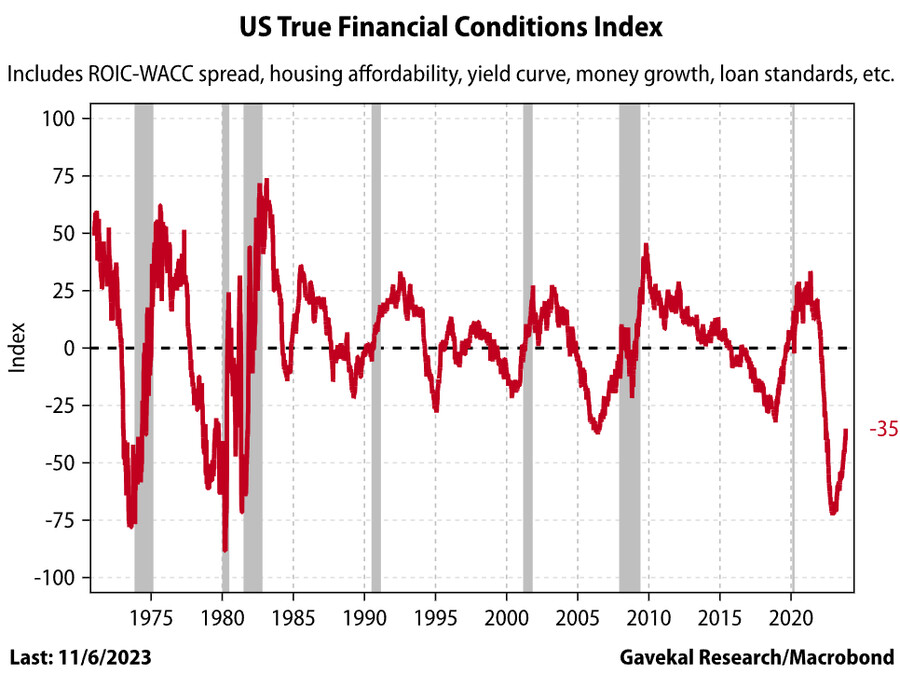
Gavekal Research의 Will Denyer에 따르면, 금융 여건은 (비록 최근 몇 달 동안 완화되기는 했지만) 2008년보다 더 긴축적임
→ 자본 조달 비용과 자본 수익률의 격차, 신용 스프레드, 주택 구입 능력 지수 등을 포함
즉, 많은 투자자들의 믿음과 달리, 경기 침체를 피하는 건 쉽지 않을 것이라는 의미
이 분석이 맞다면, 금융 여건은 이미 충분히 긴축적이므로, 채권은 매수 대상이 되지만, 주식은 그렇지 않음
미국 통화량 (M2)은 작년에 전월 대비 감소세를 보였는데, 이는 역사상 처음 있었던 일
하지만 M2의 총량은 여전히 매우 높은 수준임
통화량의 변화율이 중요하다면, 경기 침체 위험은 매우 높으며, 심지어 불가피할 수도 있음
하지만 통화량 자체는 여전히 많기 때문에, 경기 침체를 상당 기간 막을 수 있을 것
즉, 긴축 통화 정책이 실물 경제에 영향을 미치는데 소요되는 시간이 더 길어질 수 있다는 의미
1) 단기적 관점
큰 시장 랠리는 모순적인 것으로 보임
자산 가격이 상승하면, 금융 여건이 완화되며, 이는 중앙은행의 긴축 재개로 이어질 것이기 때문
그러나 지난주 랠리를 보면, 위험 자산이 올해 말까지 오를 가능성을 배제할 수 없음
2) 장기적 관점
모순적인 상황 (딜레마)
금융 여건이 타이트하다면, 경기 침체는 불가피하기 때문에, 채권 매수/주식 매도
금융 여건이 완화적이라면, 가까운 미래에 중앙은행이 금리를 추가 인상해야 할 것
=========================================
The economy is slowing, and monetary authorities think financial conditions are tight. A big market rally could upset that view.
2023년 11월 6일 오후 2:01 GMT+9
By John Authers
John Authers is a senior editor for markets and Bloomberg Opinion columnist. A former chief markets commentator at the Financial Times, he is author of “The Fearful Rise of Markets.”

US consumer spending will be tested in coming months.
Photographer: Stephanie Keith/Bloomberg
Tipping Point?
What just happened? Last week was a busy one for macroeconomic announcements. The essential points to emerge from it are as follows:
1. The US Treasury cut back slightly on the amount of long-term bonds it’s planning to auction, compared to prior plans;
2. The Bank of Japan allowed 10-year yields to rise, but didn’t release control completely, as some thought possible;
3. The Federal Reserve offered guidance taken as a strong hint that it didn’t plan any more rate hikes;
4. US unemployment data were both weaker than for the month before, and weaker than expected.
The first three make clear that global authorities aren’t necessarily prepared to let bond yields run riot — a notion that had gained strength since Jerome Powell’s interview with David Westin of Bloomberg TV last month, where he said that yields would “play out” and that he wasn’t “blessing” any particular level. This matters. Central bankers and finance ministers aren’t madly driving the economy or the financial system until something crashes, and don’t want to take the risk of a disorderly surge in bond yields.
The fourth suggests that the direction of US labor markets is weakening, which in turn implies that it will be easier to bring inflation down. Rising unemployment could yet force interest rates down fast, as it has done several times in the past.
A change in direction at the margin matters for the economy and for markets. It always does. But we need to keep this in context. The unemployment rate rose to 3.9%. That’s its highest since January of last year. But in historic terms, it’s not very high at all and there could be much further to go. In this chart, I’ve excluded the months when the unemployment rate was most distorted by the pandemic, for legibility:
Private sector payrolls are still growing at a normal rate. The rate of change matters, and it shows deceleration, but companies are still expanding their workforce:
Meanwhile, the single most important aspect of labor growth as it affects inflation, wage growth, came in slightly above expectation. Average hourly earnings are now rising at 4.1% per year, which is a great salve for the stagnation in the years after the Global Financial Crisis. The strength of recent industrial actions, led by what appears to be a very generous deal won by the United Auto Workers, suggests that labor’s bargaining power is still in the ascendant, at least for now. So it’s hard to see this measure as being particularly positive for markets, although again, to be clear, it is trending in the direction that most investors want to see:
All this said, how exactly has the market reacted? This is where it gets very interesting. After a summer in which the Fed and other central banks had convinced markets that they really would keep rates “higher for longer,” that belief has taken a sharp knock. Bloomberg’s estimates of the rates priced in for the Fed in January of 2025, and for the European Central Bank in June next year, have dropped very sharply. The assumption once more is that the easing cycle will get going next year and move quite swiftly once it starts:
That’s quite a move. As for the critical 10-year Treasury yield, it had looked as though the bond selloff was overdone. Last week’s surge back into bonds has left the 10-year yield challenging the short-term support of its 50-day moving average. A few more days of traffic in the same direction are needed before we can clearly say that the upward trend is over:
Within stocks, Bloomberg’s Factors To Watch service reveals that there was a surge out of defensive “quality” stocks with well-defended balance sheets and earnings, which are viewed as conservative investments in difficult times, while there was a big rebound in the stocks that had been most heavily sold short, meaning that investors were betting against them. Anyone who had been assuming imminent disaster decided they needed to rethink swiftly:
The essential asset allocation choice between stocks and bonds remains more finely balanced than ever. Proxied by the main exchange-traded funds tracking the S&P 500 and Bloomberg’s index of Treasuries dated 20 years or longer (universally known by their tickers SPY and TLT), we find that the dramatic upward trend for stocks compared to bonds remains intact, but that the last few days have brought it back to test short-term resistance, despite the rise in stocks. If bonds were to gain more, there is a lot further for this ratio to move:
It’s in the credit market that the response to last week begins to stretch credulity. Corporate credit, and in particular high-yield credit, or “junk,” has held up remarkably throughout the rising rate period that began in January last year. Credit indexes have finally begun to give way in the face of evidence of tightening lending standards, bankruptcies and delinquencies. In the case of high-yield, all of that decline has been reversed. Bloomberg’s US high-yield index is back as elevated as it’s been since April last year:
The economy is slowing, and the monetary authorities think conditions are tight and are worried about letting them get too tight — so buy speculative credit?
To try to understand how this can possibly be reconciled, we need to dive into financial conditions.
Conditional Surrender
Monetary policy, Powell has reminded us, works through tightening financial conditions and deterring economic activity. That takes time to work its way through the system. Or, in the words of Milton Friedman, it has a lag.
Of late, Powell has been emphasizing the work that tighter conditions — principally the higher 10-year yield — are doing for the Fed. That cheered many by suggesting that higher rates wouldn’t be necessary, and that’s probably been confirmed by the events of last week.
However, various problems remain. If there’s a monetary lag, and rates have been rising for 18 months, the implication is that conditions could get tighter for another 18 months as well. If that does happen, how exactly will it be possible to avoid a recession? How do you define what conditions matter in any case? And if it’s the market that has made conditions tighter, it follows that it can also make them looser. Buying things like credit because tight conditions mean there will be no more rate hikes is self-defeating, as it loosens conditions again.
For a demonstration of this last effect, here’s the Goldman Sachs financial conditions index (whose genesis Bloomberg Opinion colleague Bill Dudley explains here). It’s defined by its inventors as “a weighted average of riskless interest rates, the exchange rate, equity valuations, and credit spreads, with weights that correspond to the direct impact of each variable on GDP.” It suggests that conditions were as tight as they had been all year to start last week, and since then they’ve dropped more than half of the way toward neutral:
This is a classic example of what the financier George Soros calls “reflexivity” — the capacity of markets to create their own reality, and not just reflect an external state of affairs. For an even more startling example, Bloomberg’s own measure of eurozone financial conditions suggests that last week saw a flip from tight to loose. Despite everything, financial conditions are no longer particularly limiting, and are as loose as they were at the end of 2021, before the tightening cycle began:
Moving on to definitions, the longest running index in use today is kept by the Chicago Fed. It’s constructed to have an average value of zero, and then its scale is measured by the number of standard deviations by which conditions differ from that average. This means that the index grows less variable over time, but the general pattern is that conditions are usually somewhat easy — and that when they tighten, they can get very tight indeed. But that doesn’t apply at present. Looking back 50 years, we discover that national financial conditions were actually looser than average at the beginning of last week:
That suggests that monetary policy still isn’t biting. But the Fed has a more recent internal benchmark, explained here, which is published monthly and currently available until the end of September. It’s based on seven variables: the fed funds rate, the 10-year yield, the 30-year fixed mortgage rate, the triple-B corporate bond yield, Dow Jones’ total stock market index, the Zillow house price index, and the nominal broad dollar index, and is weighted according to the impact they’re each having on the economy. The index shows the impact that the change in these measures in the preceding three years will have on gross domestic product over the next year, and it suggests life was getting difficult by the end of September:
At the point that Powell gave his press conference last Wednesday, this index must have looked terrible. Steven Englander of Standard Chartered PLC has published his own estimate of where that measure is now — and by his reckoning, conditions are as difficult as they’ve been since the crisis of 2008-09. With asset prices at the level they started this week, the index implied that conditions were tight enough to take 1.1 percentage points off baseline gross domestic product growth in the year ahead:
If we look at the “true financial conditions index” kept by Will Denyer of Gavekal Research (described in Points of Return here), which focuses on issues such as the gap between the return on and cost of capital, credit standards and housing affordability, rather than on market measures that he regards as more of a measure of risk appetite, we find an almost totally opposite picture. Conditions have been easing in the last few months, but remain tighter than even in 2008. That implies that a recession is harder to avoid than many now seem to assume:
On this analysis, conditions are already tight enough to ensure that bonds are a buy, but that equities aren’t. The work has been done and we just need to wait now for the inevitable economic slowdown that follows. Finally, we come to one of the central economic debates of the last half-century: monetarism. Is the supply of money in circulation something that responds to other conditions, or does it drive them? A test case is unfolding thanks to the incredible increase in the money supply (shown in the charts below by the broad “M2” definition) during the pandemic. That has led in the last year to several out-and-out declines in the money supply, month on month, something that hadn’t happened before, while the growth of the total stock of M2 remains intact:
If it’s the change at the margin that matters, then the risk of recession appears acute. Indeed, it might be unavoidable. But the amount of excess money in the system has evidently been enough to contain this problem for much of the year. It’s effectively extended the “lag” that Friedman saw before monetary policy had an effect. How long until tighter money has the dreaded lagged effect?
For the short term, this suggests that a big market rally could be self-defeating, although the way investors piled in last week suggests that there’s every chance of a surge in risk assets from now until the end of the year. For the longer term, it begins to look like a Catch-22: If things are as tight as some believe, then bonds are a big buy and equities aren’t. If they’re in fact as loose as others imply after last week’s drama, the risk is of another swerve at some point in the near future as central banks feel obliged to up the ante again and push up yields.


